
To measure sales enablement in a way a CFO will accept, tie each metric to a line in the budget that finance already tracks: the cost of ramping new reps, deal velocity, win rate, content spend and compliance exposure. Then compare it against a baseline taken before the program started. Activity metrics like logins, content views and completed courses are how you run an enablement program. They are not how you defend one.
This post gives you nine sales enablement metrics that hold up in a budget review, how to calculate each one, how to set a baseline, and how to turn them into an ROI figure without overclaiming. The examples come from medical device and life science field teams, where long cycles and committee purchases make measurement harder than a simple sales-activity dashboard suggests.
Why do most sales enablement metrics fail in the CFO's office?
Three reasons, and all three are fixable.
They measure activity, not outcomes. "Reps opened the app 4,000 times last quarter" tells a CFO that the software was used. It says nothing about whether anyone sold more. Finance has watched plenty of well-used tools fail to change results.
They have no baseline. "Average ramp is five months" means nothing without the figure from before. Neither does a win rate with no comparison group. The CFO's real question is always a counterfactual: what would have happened without this program?
They can't be joined to revenue. Enablement data sits in one system and pipeline data sits in the CRM. If you can't connect "this content was shared on this opportunity" to "this opportunity closed," every outcome claim is a guess. That is why CRM integrations matter more to measurement than any dashboard does. Shares and buyer engagement need to land on the opportunity record automatically, because reps won't log them by hand.
What are the sales enablement metrics that survive?
Nine metrics in three groups: efficiency (spending less to get the same result), effectiveness (getting a better result), and risk (avoiding an expensive problem). Each maps to a number finance already cares about.
| Metric | How to calculate it | The budget line it maps to |
|---|---|---|
| 1. Time to first qualified opportunity | Days from a new rep's start date to their first opportunity that passes your qualification stage | Ramp cost: salary paid before a rep is productive |
| 2. Content cost per field use | Content production spend ÷ times content was presented or shared in the field | Marketing budget |
| 3. Unused content rate | Share of approved assets with zero field use in the last 90 days | Marketing budget and review workload spent on content nobody uses |
| 4. Win rate: engaged vs not | Win rate on opportunities where the buyer engaged with shared content, compared with similar opportunities where they didn't | Revenue |
| 5. Stage velocity | Median days between key stages (for example, evaluation to committee) for engaged and unengaged deals | Cash timing and forecast accuracy |
| 6. Buying group coverage | Number of distinct stakeholders on an opportunity who engaged with anything you sent | Win rate and slippage risk on large deals |
| 7. Stall rate | Share of open opportunities with no buyer engagement in the last 30 days | Forecast risk |
| 8. Certified before first case | Share of new reps who passed product certification or a scored role-play before their first customer-facing case | Ramp cost and clinical-risk exposure |
| 9. Time from withdrawal to removal | Hours from a piece being withdrawn in review to it being gone from every rep device, plus any shares of expired versions (target: zero) | Compliance and legal exposure |
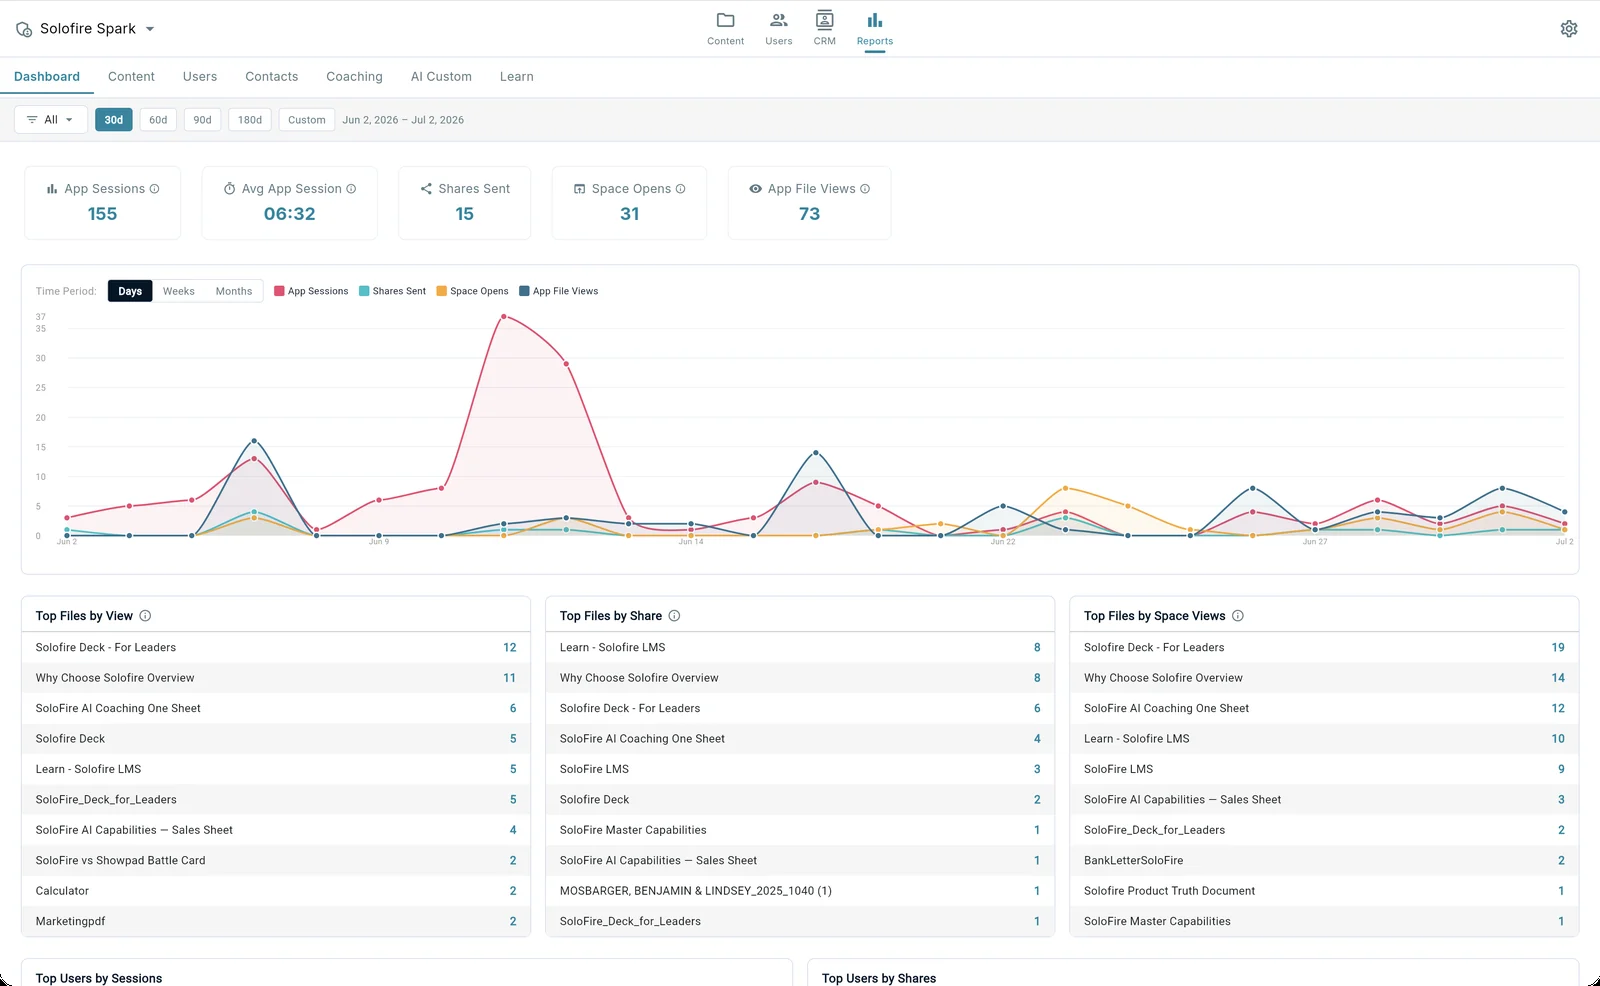
Metrics 4 through 7 depend on seeing what buyers do after a rep shares something. Email attachments can't show you that. Tracked content sharing records opens, viewers and time per file on each opportunity. Metric 8 overlaps with rep readiness, which is a separate question with its own measures. How to measure sales readiness covers the rep-level view.
A note on metrics 4 and 5
These are correlations, not proof, and a CFO will point that out. Deals where buyers engage with content may be better deals to begin with. Make the comparison fair: compare like with like (same product line, similar deal size, same quarter), and say plainly in the report that you are showing a correlation. Being candid about what the numbers can't prove makes the rest of the report more credible.
How do you set a baseline before you launch?
You can't go back and measure the past later, so do this before rollout.
- Pull four quarters of history for every metric you can calculate today: ramp dates from HR, win rate and stage dates from the CRM, and content spend from marketing.
- Write down which metrics you can't calculate yet. Most teams can't measure buyer engagement or unused content before they have an enablement platform. Record that as "no baseline" rather than inventing one.
- Hold out a comparison group if you can. Roll out to two regions first and keep a similar region on the old process for a quarter. This is the strongest evidence you can bring to a CFO, and the one most teams skip.
- Record anything unusual. A large GPO contract win, a product recall, a new competitor launch or a capital-budget freeze at major accounts will move results more than any enablement program. Log them with dates so you can separate them out later.
How do you calculate sales enablement ROI?
ROI is the value of the improvement you can reasonably attribute to the program, minus its cost, divided by its cost. The hard part is the first term. Build it from the metrics above, one at a time, and use conservative figures.
An illustration. These figures are hypothetical, not a benchmark. Say a team hires 12 reps a year. Before the program, time to first qualified opportunity was 120 days, and after two cohorts it is 90. That is 30 days sooner per hire. If a productive rep generates $X in gross margin per month, the value is roughly 12 × 1 month × $X. Finance will want to use margin, not revenue, and will discount it further for anything else that changed. Let them. A smaller number that finance helped build is worth more than a large number they don't trust.
Do the same for content cost (metric 2 before and after, multiplied by volume) and for stall rate, if you can show that engaged deals slip less. Add up only the items you can defend, and leave the others in an appendix as "not yet quantified."
For cost, include everything: licences, administrator time, content production and rep time spent in training. Simple pricing makes this term easy. SoloFire, for example, is $30 per user per month with everything included, so the licence line is headcount × 30 × 12, with no module add-ons to estimate. For the broader cost side of the equation, including what a rep and a marketing team actually cost, the older post on measuring sales ROI is a useful starting point.
Which metrics should you stop reporting to finance?
- Logins and sessions. They show usage, not value. Keep them on your operating dashboard.
- Total content views. One rep opening the same deck 200 times isn't a result.
- Number of assets produced. This rewards volume, and in a regulated company every extra asset also adds review workload and expiration risk.
- Course completions on their own. Completion without a passing score or a scored role-play measures attendance.
- Industry benchmark statistics as proof. Published sales enablement statistics are useful for making the case to start a program. Once it is running, finance wants your numbers, not an industry average.
How often should you report?
Report monthly to the sales leadership team, using the operating metrics (adoption, content use, stall rate) so they can act on problems early. Report quarterly to finance, using the nine metrics above against baseline, on one page, with correlations labeled as correlations. Do an ROI calculation once a year, built with a finance partner rather than presented to one.
The one-page format matters. A CFO who gets a 30-slide enablement review will assume the story is weak. Nine rows, a baseline column, a current column and a line explaining each change will read as confident.
What good looks like
Here is an illustration, using hypothetical figures rather than a real company's results. An enablement lead at a mid-size device company walks into a quarterly review with one page. Time to first qualified opportunity is down from 118 days to 94 across two hiring cohorts, with the comparison region flat. The unused content rate fell from 41% to 22% after marketing retired half the library. Deals with three or more engaged stakeholders closed at a noticeably higher rate than single-threaded deals of the same size, and the report labels that as a correlation. Time from withdrawal to removal is under a day, with zero expired shares.
The CFO asks two questions, both about method, and approves the renewal. For proof from teams already running this, see how teams use SoloFire. The measurement approach works whatever platform you use.
Start by picking three of the nine metrics you can baseline this month. Knowing how to measure sales enablement matters less than having a baseline before rollout, and a baseline you didn't take can't be recovered later.
Frequently Asked Questions
What are the most important sales enablement KPIs?
The ones tied to budget lines: time to first qualified opportunity (ramp cost), win rate and stage velocity on engaged versus unengaged deals (revenue and timing), content cost per field use (marketing spend), and time to remove withdrawn content (compliance exposure). Adoption metrics matter for running the program but rarely persuade finance.
How do you calculate sales enablement ROI?
Add up the value of the improvements you can reasonably attribute to the program, such as faster ramp valued at gross margin or lower content cost per use. Subtract the full program cost, including licences, admin time and content production, then divide by that cost. Build it with a finance partner and use conservative figures.
How long before sales enablement impact shows up in the numbers?
Content and adoption metrics move within a quarter. Ramp metrics need at least one or two hiring cohorts. Win rate and velocity need enough closed deals to compare, which in long medical device cycles can take two or more quarters. Take the baseline before rollout either way.
What is the difference between sales enablement metrics and sales readiness metrics?
Sales enablement metrics measure whether the program changes business results across the team. Sales readiness metrics measure whether an individual rep is prepared for a customer conversation, through certification, scored role-plays and time to first deal. Readiness feeds enablement results, but they are reported to different audiences.