UnderstandingSoloFire Analytics
We know that marketers rely on analytics and KPIs to do their jobs successfully. The SoloFire analytics dashboard gives in-depth analytics for all your content and users. This includes insights into what your reps are searching for and what files are frequently shared with prospects.
Navigating to Analytics

- First, log in to your admin account at app.solofire.com
- Once logged in, click on the Activity tab
- From here you have several ways to get the data you want. We will go over each section.
- It’s also helpful to note that you can also export .CSV reports for Users, Contacts, Content, and Sessions by clicking the pink cloud within each section.
Dashboard
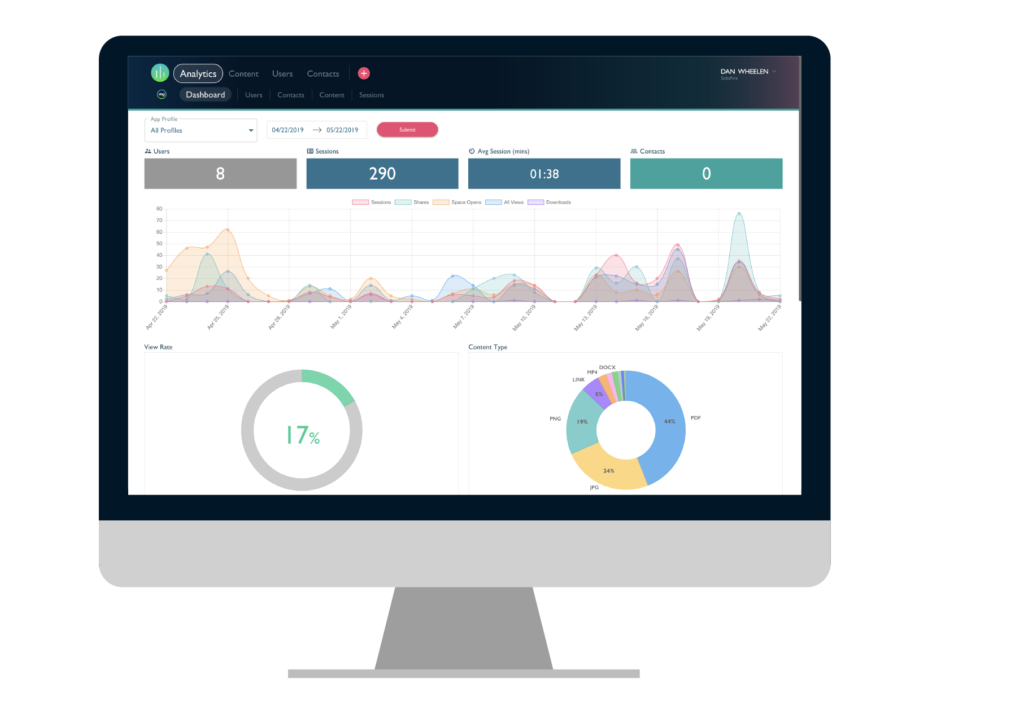
The Dashboard is the default section that you see when you click “Activity”. The dashboard provides you with a general overview of your app, user, and content analytics. This page is very visual so you can quickly see the stats you care about most, like view rate and top reps.

- Team selector: View the analytics dashboard for a single team by selecting it from the drop-down menu or select “All Teams” to view the entire company analytics. Default is set to “All Teams”.
- Date selector: Allows you to quickly select common start and end date ranges for the reporting period, or select a custom start and end date for the reporting period. You may either type the start date into the field or select it from the pop-up calendar.
- Users: Displays the number of users who have logged into the app at least once during the reporting period. You can click it to view the Users Report.
- Sessions: Displays the total number of sessions recorded by the system by all users during the reporting period. A session starts recording when the app is launched by the user and ends when the user sends an email from the app, quits the app, the app is backgrounded, or the device goes into sleep mode. You can click it to view the Contacts Report.
- Avg. Sessions (mins): Displays the average number of minutes spent per session for all users during the reporting period. You can click it to view the Sessions Report.
- Contacts: Displays the total number of contacts the app users have shared content via the app during the reporting period.
- Graph:
- Sessions: Displays the number of sessions recorded by the system by all users during the reporting period.
- Shares: Displays the number of shares recorded by the system by all users during the reporting period.
- Space Opens: Displays the number of Spaces opened by contacts during the reporting period.
- All Views: Displays the total number of assets viewed by contacts during the reporting period.
- Downloads: Displays the total number of files downloaded by contacts during the reporting period.
- View Rate: Displays the total number of assets shared verse the recipient unique views
- Content Type: Displays the total number of assets in the system and breaks it down into different content types (such as PDFs, PNGs, and links). Hover over the chart to see the total number for each content type.
- Top Reps: Displays the reps that are using the app most frequently. The ranking is based on the number of sessions and can be sorted by “Sessions” and “Average Duration”.
- Device Type: Displays the devices being used by your app users (such as MacOS and iPhone). Hover over the chart to see the total number for each device.
- Top Searches: Displays the phrases that are used to search for content within the app by app users
- Top Files by View: Displays the files that viewed most frequently within the app by app users
- Top Files by Share: Displays the files that are shared most frequently to contacts by app users
Users
The “Users” report dives deeper into your app users and their activity. Just like the dashboard, you can select what team(s) to view and what date range you want to see.

Overview
- Total Users: Displays the total number of app users for that selected team (or all teams if selected)
- Sessions: Displays the number of sessions recorded by the system by all users during the reporting period.
- Avg. App Sessions: Displays the average number of sessions recorded by the system by all users during the reporting period.
- Browse: Displays the number of files viewed within the app by app users during the reporting period.
- Total Contacts: Displays the total number of contacts the app users have shared content via the app during the reporting period.
- Shows: Displays the total number of files presented by app users while in a presentation during the reporting period.
- Shares: Displays the total number of files shared (via email, text, and link) by all users during the reported period.
- Total Opens: Displays the total number of Spaces opened by contacts during the reported period.
- Total Views: Displays the sum total of files viewed within the Space by contacts during the reported period.
- Unique Views: Displays the total count of files that have been viewed within the Space by contacts during the reported period.
- View Rate: Displays the total number of content shared verses the recipient unique views.
Users Report
User Activity: App user activity
- Name: Displays the individual user’s email/username
- Sessions: Displays the total number of sessions recorded by the system for the individual user during the reporting period
- Avg. Duration: Displays the average number of minutes spent per session for the individual user during the reporting period
- Total Duration: Displays the total number of minutes spent per session for the individual user during the reporting period
- Contacts: Displays the total number of contacts the individual user has shared content via the app.
- Browses: Displays the number of files viewed within the app by the individual user during the reporting period.
- Shows: Displays the total number of files presented by the individual user while in a presentation during the reporting period.
- Shares: Displays the total number of files shared (via email, text, and link) by the individual user during the reported period.
- Total Opens: Displays the total number of Spaces opened by the individual user’s contacts during the reported period.
- Total Views: Displays the total number of files viewed by the individual user’s contacts within their shared Space during the reported period.
- Unique Views: Displays the total count of files that have been viewed within the Space by contacts during the reported period.
- View Rate: Displays the percentage of shared content the contact has viewed.
- Avg. Duration: Displays the average number of minutes spent per session by the individual user’s contacts during the reporting period
- Total Duration: Displays the total number of minutes spent in a Space by the individual user’s contacts during the reporting period.
Contacts
The “Contacts” report dives deeper into your app users’ contacts and their activity. Just like the dashboard, you can select what team(s) to view and what date range you want to see.

Overview
- Total Contacts: Displays the total number of contacts the app users have shared content via the app during the reporting period.
- Avg. Web Session: Displays the average number of minutes spent per session for all contacts during the reporting period.
- Shows: Displays the total number of files presented to contacts during the reporting period.
- Shares: Displays the number of files shared to contacts during the reporting period.
- Total Views: Displays the total number of files viewed by all contacts within their shared Spaces during the reported period.
- View Rate: Displays the percentage of shared content the contact has viewed.
Contacts Report
User Activity: App user activity
- Contact: Displays the individual contact’s email/username
- Last Share: Displays the last recorded date a file was shared with them via the app.
- Last View: Displays the last recorded date the contact viewed shared content.
- Shows: Displays the total number of files presented to the individual contact during the reporting period.
- Shares: Displays the number of files shared with the individual contact during the reporting period.
- Total Duration: Displays the total number of minutes spent in Spaces by the individual contact during the reporting period.
- Total Opens: Displays the total number of Spaces opened by the individual user’s contacts during the reported period.
- Total Views: Displays the total number of files viewed by the individual user’s contacts within their shared Space during the reported period.
- Unique Views: Displays the total count of files that have been viewed within the Space by contacts during the reported period.
- View Rate: Displays the percentage of shared content the contact has viewed.
- Downloads: Displays the total number of times files have been downloaded from the shared Space by the contact during the reporting period.
- Avg. Duration: Displays the average number of minutes spent per session by the individual user’s contacts during the reporting period
- Total Duration: Displays the total number of minutes spent in a Space by the individual user’s contacts during the reporting period.
Content
The “Content” report dives deeper into your content and the activity by app users and contacts. Just like the dashboard, you can select what team(s) to view and what date range you want to see.

Overview
- Total Assets: The total number of assets within your platform recorded by the system during the reporting period.
- Avg. Viewing: Displays the average duration of time a file is viewed by contacts during the reporting period.
- Browse: Displays the number of times files have been viewed within the app by app users during the reporting period.
- Shows: Displays the number of times files have been presented by app users while in a presentation during the reporting period.
- Shares: Displays the number of times files have been shared (via email, text, and link) by app users during the reported period.
- Total views: Displays the sum total number of times files have been viewed by contacts within shared Spaces during the reported period.
- Unique Views: Displays the total unique views of files within a Space during the reported period.
- View Rate: Displays the total number of content shared verse the recipient unique views.
- Downloads: Displays the total number of times files have been downloaded by contacts from shared Spaces during the reporting period.
Content Report
User Activity: App user activity
- Browse: Displays the number of times the individual file has been viewed within the app by app users during the reporting period.
- Shows: Displays the number of times the individual file has been presented by app users while in a presentation during the reporting period.
- Shares: Displays the number of times the individual file has been shared (via email, text, and link) by app users during the reported period.
- Total Views: Displays the total number of the individual file has been viewed by contacts within shared Spaces during the reported period.
- Unique Views: Displays the total unique views of files within a Space during the reported period.
- View Rate: Displays the total number of content shared verse the recipient unique views.
- Downloads: Displays the total number of times files have been downloaded from the shared Space by the contact during the reporting period.
- Avg/Total Duration: The average time per session and the total amount of time a file has been viewed in a Space.
Sessions
The “Sessions” report is essentially a log of every session that has taken place during the reporting period. Just like the dashboard, you can select what team(s) to view and what date range you want to see.

Overview
- Sessions: The total number of sessions within your platform recorded by the system by all app users during the reporting period.
- Avg. App Session: Displays the average number of minutes spent per session for all contacts during the reporting period.
- Browse: Displays the number of times files have been viewed within the app by app users during the reporting period.
- Shows: Displays the number of times files have been presented by app users while in a presentation during the reporting period.
- Shares: Displays the number of times files have been shared (via email, text, and link) by app users during the reported period.
- Total views: Displays the total number of times files have been viewed by contacts within shared Spaces during the reported period.
- Downloads: Displays the total number of times files have been downloaded by contacts from shared Spaces during the reporting period.
Sessions Report
User Activity: App user activity
- Browse: Displays the number of files viewed within the app by app users during the reporting period for the individual session.
- Shows: Displays the total number of files presented by app users while in a presentation during the reporting period for the individual session.
- Shares: Displays the total number of files shared (via email, text, and link) by all users during the reported period for the individual session.
- Total Opens: Displays the total number of Spaces opened by contacts during the reported period for the individual session.
- Total Views: Displays the total number of files viewed within the Space by contacts during the reported period for the individual session.
- Downloads: Displays the total number of files downloaded by the individual contact within their shared Space during the reporting period for the individual session.
- Duration: Displays the total number of minutes spent in Spaces by the individual contact during the reporting period for the individual session.